Docsity
Docsity

Prepare for your exams

Study with the several resources on Docsity


Earn points to download

Earn points by helping other students or get them with a premium plan


Guidelines and tips
Guidelines and tips

Measuring Risk of Forest Products Companies: A Study by Hotvedt and Tedder, Lecture notes of Agricultural economics

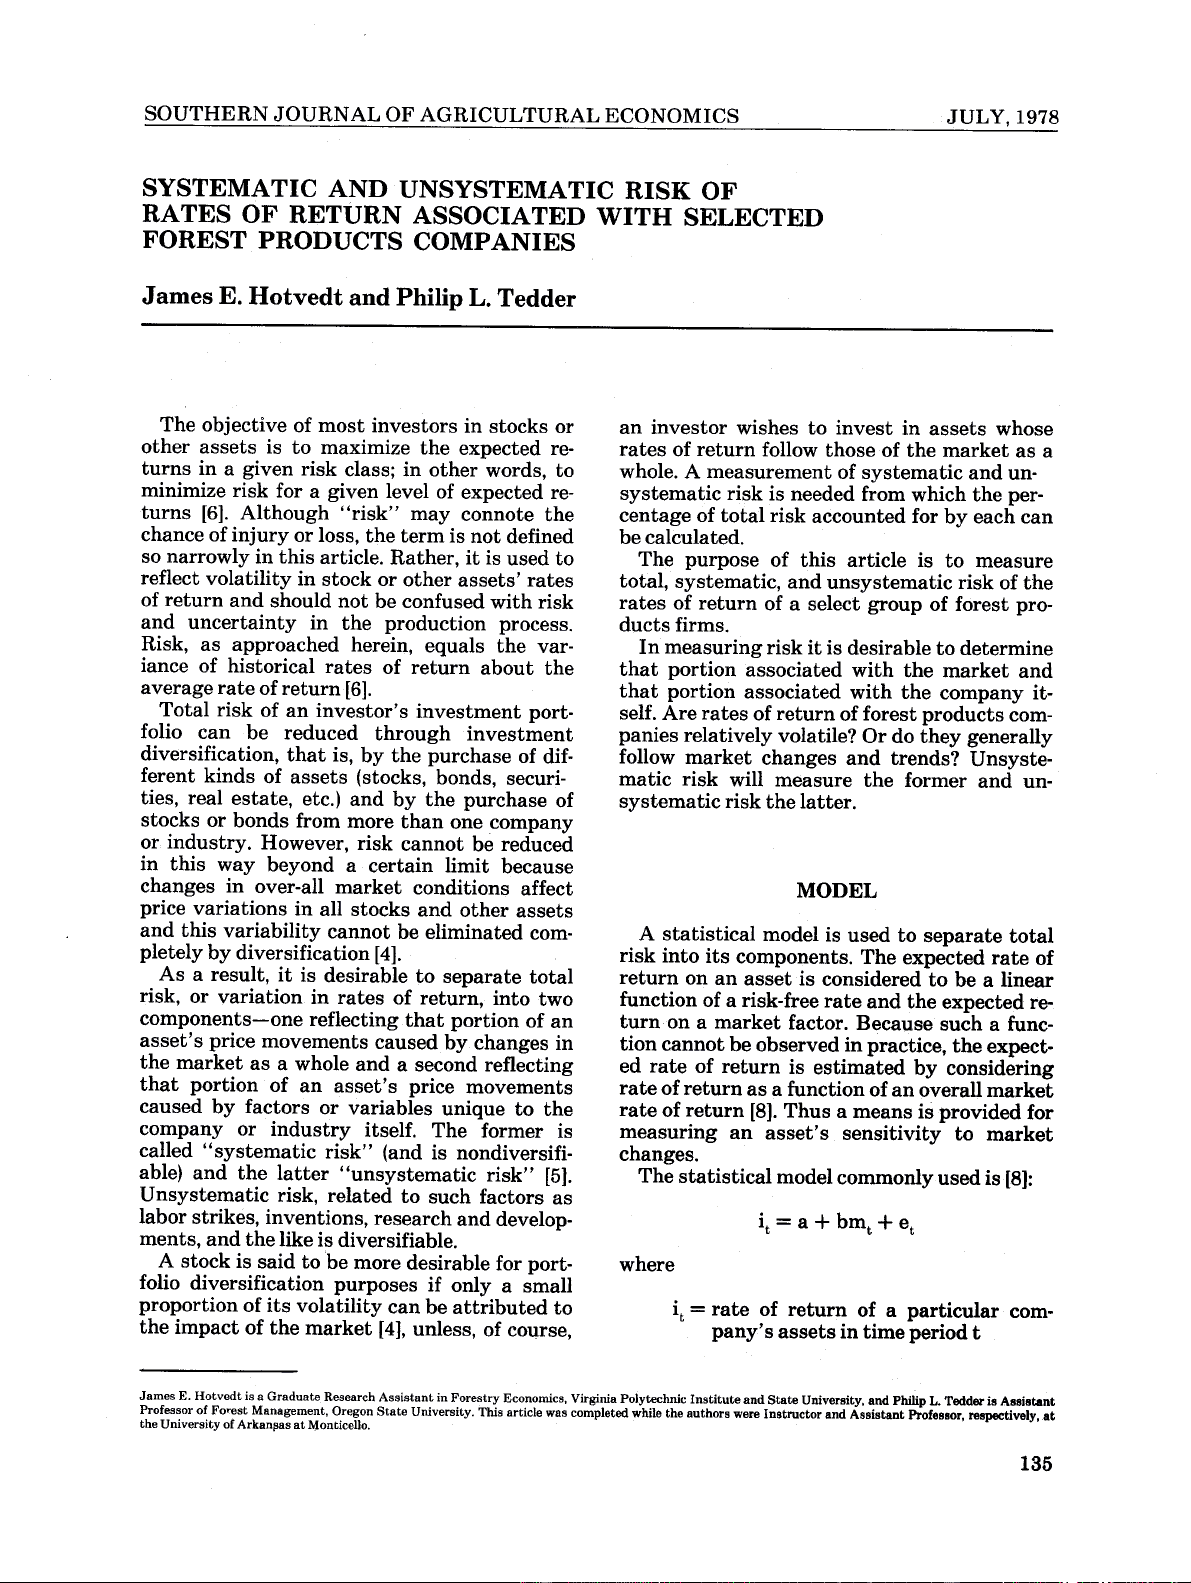
A research article published in the southern journal of agricultural economics in 1978. The authors, james e. Hotvedt and philip l. Tedder, investigate the total risk, systematic risk, and unsystematic risk of rates of return for a select group of forest products companies. The article explains the concept of risk and its components, and presents a model for separating total risk into systematic and unsystematic risk using regression analysis. The study aims to help investors understand the risk associated with investing in forest products companies and to aid in determining whether large forest products companies are more susceptible to market or industry-specific factors.

What you will learn

  • Which factors contribute to the systematic and unsystematic risk of forest products companies?
  • What is the difference between systematic and unsystematic risk?
  • How can the total risk of an asset be separated into systematic and unsystematic risk?

Typology: Lecture notes

2021/2022

Uploaded on 08/05/2022

nguyen_99
nguyen_99 🇻🇳

4.2

(80)

1K documents

1 / 4

Toggle sidebar

This page cannot be seen from the preview

Don't miss anything!

bg1
SOUTHERN JOURNAL
OF
AGRICULTURAL
ECONOMICS
JULY,
1978
SYSTEMATIC
AND
UNSYSTEMATIC
RISK
OF
RATES
OF
RETURN ASSOCIATED
WITH
SELECTED
FOREST
PRODUCTS
COMPANIES
James
E.
Hotvedt
and Philip
L.
Tedder
The
objective
of
most
investors
in
stocks
or
an
investor
wishes
to
invest
in
assets
whose
other
assets
is
to
maximize
the
expected
re-
rates
of
return
follow
those
of
the
market
as
a
turns
in
a
given
risk
class; in
other
words,
to
whole.
A
measurement
of
systematic
and
un-
minimize
risk
for
a
given
level
of
expected
re-
systematic risk
is
needed from which
the
per-
turns
[6].
Although
"risk"
may
connote
the
centage
of
total
risk
accounted
for
by
each
can
chance
of
injury
or loss,
the
term
is
not
defined
be
calculated.
so
narrowly
in
this
article.
Rather,
it
is
used
to
The
purpose
of
this
article
is
to
measure
reflect
volatility
in
stock
or
other
assets'
rates
total,
systematic, and
unsystematic
risk
of
the
of
return
and
should
not
be
confused
with
risk
rates
of
return
of
a
select
group
of
forest
pro-
and
uncertainty
in
the
production
process.
ducts
firms.
Risk,
as
approached
herein,
equals
the
var-
In
measuring
risk
it
is
desirable to determine
iance
of
historical
rates
of
return
about
the
that
portion
associated
with
the
market
and
average
rate
of
return
[6].
that
portion
associated
with
the
company
it-
Total risk
of
an
investor's
investment
port-
self.
Are
rates
of
return
of
forest
products
com-
folio
can
be
reduced
through investment
panies relatively
volatile?
Or
do
they
generally
diversification,
that
is,
by
the
purchase
of
dif-
follow
market
changes
and
trends?
Unsyste-
ferent
kinds
of
assets
(stocks,
bonds,
securi-
matic risk
will
measure
the
former
and
un-
ties, real
estate,
etc.)
and by
the
purchase
of
systematic
risk
the latter.
stocks
or
bonds
from more
than
one
company
or
industry.
However,
risk
cannot
be
reduced
in
this
way
beyond
a
certain limit
because
changes
in
over-all
market
conditions
affect
MODEL
price
variations
in
all
stocks
and
other
assets
and
this
variability
cannot
be
eliminated
com-
A
statistical
model
is
used
to
separate
total
pletely
by diversification
[4].
risk into
its
components.
The
expected
rate
of
As
a
result,
it
is
desirable
to separate
total
return
on
an
asset
is considered
to
be a
linear
risk,
or
variation
in
rates
of
return,
into
two
function
of
a
risk-free
rate
and
the
expected
re-
components-one
reflecting
that
portion
of
an
turn
on a
market
factor. Because
such
a
func-
asset's
price
movements
caused
by
changes
in
tion
cannot
be
observed
in
practice,
the
expect-
the
market
as
a whole
and
a
second
reflecting
ed
rate
of
return
is
estimated
by
considering
that
portion
of
an
asset's
price
movements
rate
of
return
as
a
function
of
an
overall
market
caused
by
factors
or
variables unique
to
the
rate
of
return
[8].
Thus
a
means
is
provided
for
company
or
industry
itself.
The
former
is
measuring an
asset's
sensitivity
to
market
called
"systematic risk"
(and
is
nondiversifi-
changes.
able)
and
the
latter
"unsystematic
risk"
[51.
The
statistical
model
commonly
used
is
[8]:
Unsystematic
risk,
related to
such
factors
as
labor
strikes,
inventions,
research and
develop-
i
t
=
a
+
bm
t
+ e
t
ments,
and
the
like
is
diversifiable.
A
stock
is
said
to
be
more
desirable
for
port-
where
folio
diversification
purposes
if
only
a
small
proportion
of
its
volatility
can
be
attributed
to
i
t
=
rate
of
return
of
a
particular
corn-
the
impact
of
the
market
[4],
unless,
of
course,
pany's
assets
in
time
period
t
James
E.
Hotvedt
is
a
Graduate
Research
Assistant
in
Forestry
Economics,
Virginia
Polytechnic
Institute
and
State
University,
and
Philip
L.
Tedder
is
Assistant
Professor
of
Forest
Management,
Oregon
State
University.
This
article
was
completed
while
the
authors
were
Instructor
and
Assistant
Professor,
respectively, at
the
University
of
Arkansas
at
Monticello.
135
pf3
pf4

Partial preview of the text

Download Measuring Risk of Forest Products Companies: A Study by Hotvedt and Tedder and more Lecture notes Agricultural economics in PDF only on Docsity!

SOUTHERN JOURNAL OF AGRICULTURAL ECONOMICS JULY, 1978

SYSTEMATIC AND UNSYSTEMATIC RISK OF

RATES OF RETURN ASSOCIATED WITH SELECTED

FOREST PRODUCTS COMPANIES

James E. Hotvedt and Philip L. Tedder

The objective of most investors in stocks or an investor wishes to invest in assets whose

other assets is to maximize the expected re- rates of return follow those of the market as a

turns in a given risk class; in other words, to whole. A measurement of systematic and un-

minimize risk for a given level of expected re- systematic risk is needed from which the per-

turns [6]. Although "risk" may connote the centage of total risk accounted for by each can

chance of injury or loss, the term is not defined be calculated.

so narrowly in this article. Rather, it is used to The purpose of this article is to measure

reflect volatility in stock or other assets' rates total, systematic, and unsystematic risk of the

of return and should not be confused with risk rates of return of a select group of forest pro-

and uncertainty in the production process. ducts firms.

Risk, as approached herein, equals the var- In measuring risk it is desirable to determine

iance of historical rates of return about the that portion associated with the market and

average rate of return [6]. that portion associated with the company it-

Total risk of an investor's investment port- self. Are rates of return of forest products com-

folio can be reduced through investment panies relatively volatile? Or do they generally

diversification, that is, by the purchase of dif- follow market changes and trends? Unsyste-

ferent kinds of assets (stocks, bonds, securi- matic risk will measure the former and un-

ties, real estate, etc.) and by the purchase of systematic risk the latter.

stocks or bonds from more than one company

or industry. However, risk cannot be reduced

in this way beyond a certain limit because

changes in over-all market conditions affect MODEL

price variations in all stocks and other assets

and this variability cannot be eliminated com- A statistical model is used to separate total

pletely by diversification [4]. risk into its components. The expected rate of

As a result, it is desirable to separate total return on an asset is considered to be a linear

risk, or variation in rates of return, into two function of a risk-free rate and the expected re-

components-one reflecting that portion of an turn on a market factor. Because such a func-

asset's price movements caused by changes in tion cannot be observed in practice, the expect-

the market as a whole and a second reflecting ed rate of return is estimated by considering

that portion of an asset's price movements rate of return as a function of an overall market

caused by factors or variables unique to the rate of return [8]. Thus a means is provided for

company or industry itself. The former is measuring an asset's sensitivity to market

called "systematic risk" (and is nondiversifi- changes.

able) and the latter "unsystematic risk" [51. The statistical model commonly used is [8]:

Unsystematic risk, related to such factors as

labor strikes, inventions, research and develop- i t = a + bm t + e t

ments, (^) and the like is diversifiable.

A stock is said to be more desirable for port- where

folio diversification purposes if only a small

proportion of its volatility can be attributed to i t = rate of return of a particular corn-

the impact of the market [4], unless, of course, pany's assets in time period t

James (^) E. Hotvedt is a Graduate Research Assistant in Forestry (^) Economics, Virginia Polytechnic Institute and State University, (^) and Philip L. Tedder is Assistant Professor (^) of Forest Management, Oregon State University. (^) This article was completed while the authors were (^) Instructor and Assistant Professor, respectively, at the University (^) of Arkansas at Monticello.

a = y-intercept an^ index^ of^ systematic,^ nondiversifiable risk. b = slope of^ the^ regression^ line^ It^ indicates^ how^ the^ return^ for^ a^ given^ asset M (^) t = market rate^ of^ return^ in^ time^ period^ t^ varies^ with the^ market.^ If^ the^ coefficient^ is and greater^ than^ one,^ an^ asset's^ rate^ of^ return^ in- e (^) t = random error about the regression creases^ (decreases)^ at^ a^ faster^ rate than^ the line in time period t.^ market's.^ This^ value^ indicates^ what^ Francis^ 16] calls an "aggressive asset."^ A^ coefficient^ less For the five^ forest^ products^ companies,^ the^ than^ one^ indicates^ that^ an^ asset's^ rate^ of

assets to be evaluated are^ their^ common^ stocks.^ return^ moves^ counter^ to^ that^ of^ the^ market^ as^ a

The rate of^ return^ (it) on^ each^ company's^ com-^ whole^ [3].

mon stocks is calculated as^ follows^ [6]:^ The^ statistic^ representing^ random^ error^ (e^ t) D + P. -P about the^ characteristic^ line^ cannot^ be^ esti- t t+- Pt mated^ in^ practice.^ Theoretically,^ however,^ it it= represents that portion of total risk^ affected^ by t characteristics unique^ to^ the^ company^ or industry itself.

^^^~~~~~where ~The coefficient of^ determination^ (r

(^2) ) is a

measure of the percentage of^ total^ risk^ (varia- Dt (^) t = cash dividendcash dividend forfor^ timetime^ periodperiod^ tt tion in the rate of return of the asset) explained Pt+l = common stock price at end of time by changes in the market index. Thus, the coef- period=periodmo tt^ ando ct b iand ficient of determination is that statistic used to

Pt = common stock price at beginning of measure the^ percentage^ of^ total^ risk^ accounted

~~timet. period ^for by systematic,^ nondiversifiable^ risk^ [61.

The market rate of return (M) is reflected by^ EXAMPLE Standard and Poor's^ (SP)^ market^ index^ [4,^ 6]. The market rate of return is calculated^ as:^ unsystematic^ risk Total, systematic, and^ unsystematic^ risk associated with the^ rates^ of^ return^ of^ five SPt+-SPt forest products^ companies^ are^ calculated^ to Mt- p illustrate how the model is used. The firms SPt analyzed are Crown Zellerbach,^ Potlatch, where International^ Paper,^ Westvaco,^ and Weyerhaeuser. Each^ firm^ is^ large,^ having^ land- SP+ = value of^ the^ SP^ index^ at^ the^ end^ of^ holdings^ and processing^ plants^ in^ more^ than the time period^ t^ and^ one^ region^ of^ the^ country.^ The^ analysis^ allows SP = value of the SP index^ at^ the^ begin-^ total^ risk^ and^ its^ components^ for^ each^ of^ the ning of time period t.^ companies^ to^ be^ compared.^ In^ addition,^ the results of such an analysis aid^ in^ determining

Dividends are^ excluded^ purposely^ from^ the^ whether^ large^ forest^ products^ companies^ are market rate^ of^ return^ calculations and^ thus^ the^ more^ or^ less^ susceptible^ than^ companies^ in resulting index is downward biased.^ Provided^ other^ industries^ to^ factors^ that^ affect^ the that dividends are excluded consistently,^ market^ as^ a^ whole,^ or^ to^ factors^ which^ are^ in- comparisons of statistical results and^ of^ risk^ herent^ or^ unique^ to^ the^ particular^ companies^ or are valid [6]. industries^ themselves. The model^ results^ in^ a^ regression^ line,^ often^ TABLE^ 1.^ RESULTS^ OF^ CHARACTERIS- termed a "characteristic line," and the charac- TIC LINE ANALYSIS teristic line reflects the^ "nature^ of^ systematic and unsystematic risks; it^ shows^ the^ relation- ships of some asset with^ the^ market"^ [6].^ ompany^ Charaeristic^ F-Valuea Indeed, the hypothesis is that the rate of (^) Crown Z. i (^) t == 0.05270.0527^ ++^ 1.5491.549^ mt .356.356^ 14. return of an asset^ (it )^ is^ a^ linear^ function^ of^ a market factor common to^ all^ assets^ (Mt )^ and^ of^ Potlatch^ i^ =^ 0.0131^ +^ 0.929^ m^ .312^ 11. an independent^ factor^ unique^ to^ the particular^ Int.^ Pap.^ i^ t^ =^ 0.0631^ +^ 1.0292^ mt^ .242^ 8.

asset (et) [3]. Westvaco^ i^ t =^ 0.0523^ +^ 1.2406^ mt^ .279^ 10.

The y-intercept (a) is the asset's rate of Weyco i =0.0732^ +^ 0.9071^ m^ .123^ 3. return when the^ market^ is^ stationary^ (M^ t =^ 0). The beta^ coefficient^ (b)^ is^ a^ measure^ of^ the slope of the characteristic line; it measures the aAll equations and beta coefficients^ are^ significant^ at^ the volatility of an asset's rate of return in relation .05^ level^ except^ those^ for^ Weyerhaeuser^ which^ are^ signifi-

to the market rate of return [1]^ and^ therefore^ is^ cant^ at^ the^ .10^ level.

With such an^ approach,^ however,^ the^ compari-^ return^ does^ tend^ to^ persist^ over^ time^ then^ this

sons of risks associated^ with the^ selected^ pattern^ might^ continue^ in^ the^ future.^ If^ so, group of forest products firms would have been^ then^ risk^ analysis^ may^ provide^ an investor

precluded. with^ a^ means^ of^ estimating^ the^ likely^ degree^ of

Future work involves isolating those^ factors^ fluctuation^ or^ variation^ of^ his^ investments^ in which contribute to the unsystematic risk^ relation to^ the market^ and^ the risk^ that^ their portion of the rates of returns to^ forest^ product^ value^ may,^ at^ any^ time,^ be^ below^ his expecta- companies. tions^ [4]. If the relative volatility of^ an^ asset's^ rate^ of

REFERENCES

[1] Babcock, Guilford C.^ "A^ Note^ on^ Justifying^ Beta^ as^ a^ Measure^ Risk,"^ Journal^ of^ Finance,^ Vol-

ume 27, No.^ 3,^ 1972,^ pp.^ 699-702. [2] Baesel, Jerome B. "On the Assessment^ of^ Risk:^ Some^ Further^ Considerations,"^ Journalof^ Fi- nance, Volume 29, No.^ 5,^ 1974,^ pp.^ 1491-1494. [3] Blume, MarshallE. "On^ the^ Assessment^ of^ Risk,"^ Journalof^ Finance,^ Volume^ 26,^ No.^ 1,^ 1971, pp. 1-10. [4] Brealey,^ Richard^ A.^ An^ Introduction^ to^ Risk^ and^ Return^ from^ Common^ Stocks,^ Cambridge: The MIT Press, Massachusetts Institute^ of^ Technology,^ 1969. [5] Cohen, Jerome B.,^ Edward^ D.^ Zinbarg,^ and^ Arthur^ Zeikel.^ Investment^ Analysis^ and^ Portfolio Management, Homewood, Illinois:^ Dow^ Jones-Irwin^ Inc.,^ 1973. [6] Francis,^ Jack^ Clark.^ Investments:^ Analysis and^ Management,^ New York:^ McGraw-Hill Book Company, 1972. [7] King, B. F. "Market and Industry Factors^ in^ Stock^ Price^ Behavior,"^ Journalof^ Business,^ Vol- ume 39, No. 2, 1966, pp. 139-190. [8] Schwendiman, Carl J. and George E.^ Pinches.^ "An^ Analysis^ of^ Alternative^ Measures^ of^ Invest- ment Risk," Journalof^ Finance,^ Volume^ 30,^ No.^ 1,^ 1975,^ pp.^ 193-200.