Download ShadowDraw: Real-Time User Guidance for Freehand Drawing - Interactive System and more Lecture notes Technical Drawing in PDF only on Docsity!
ShadowDraw: Real-Time User Guidance for Freehand Drawing
Yong Jae Lee
University of Texas at Austin
C. Lawrence Zitnick
Microsoft Research
Michael F. Cohen
Microsoft Research
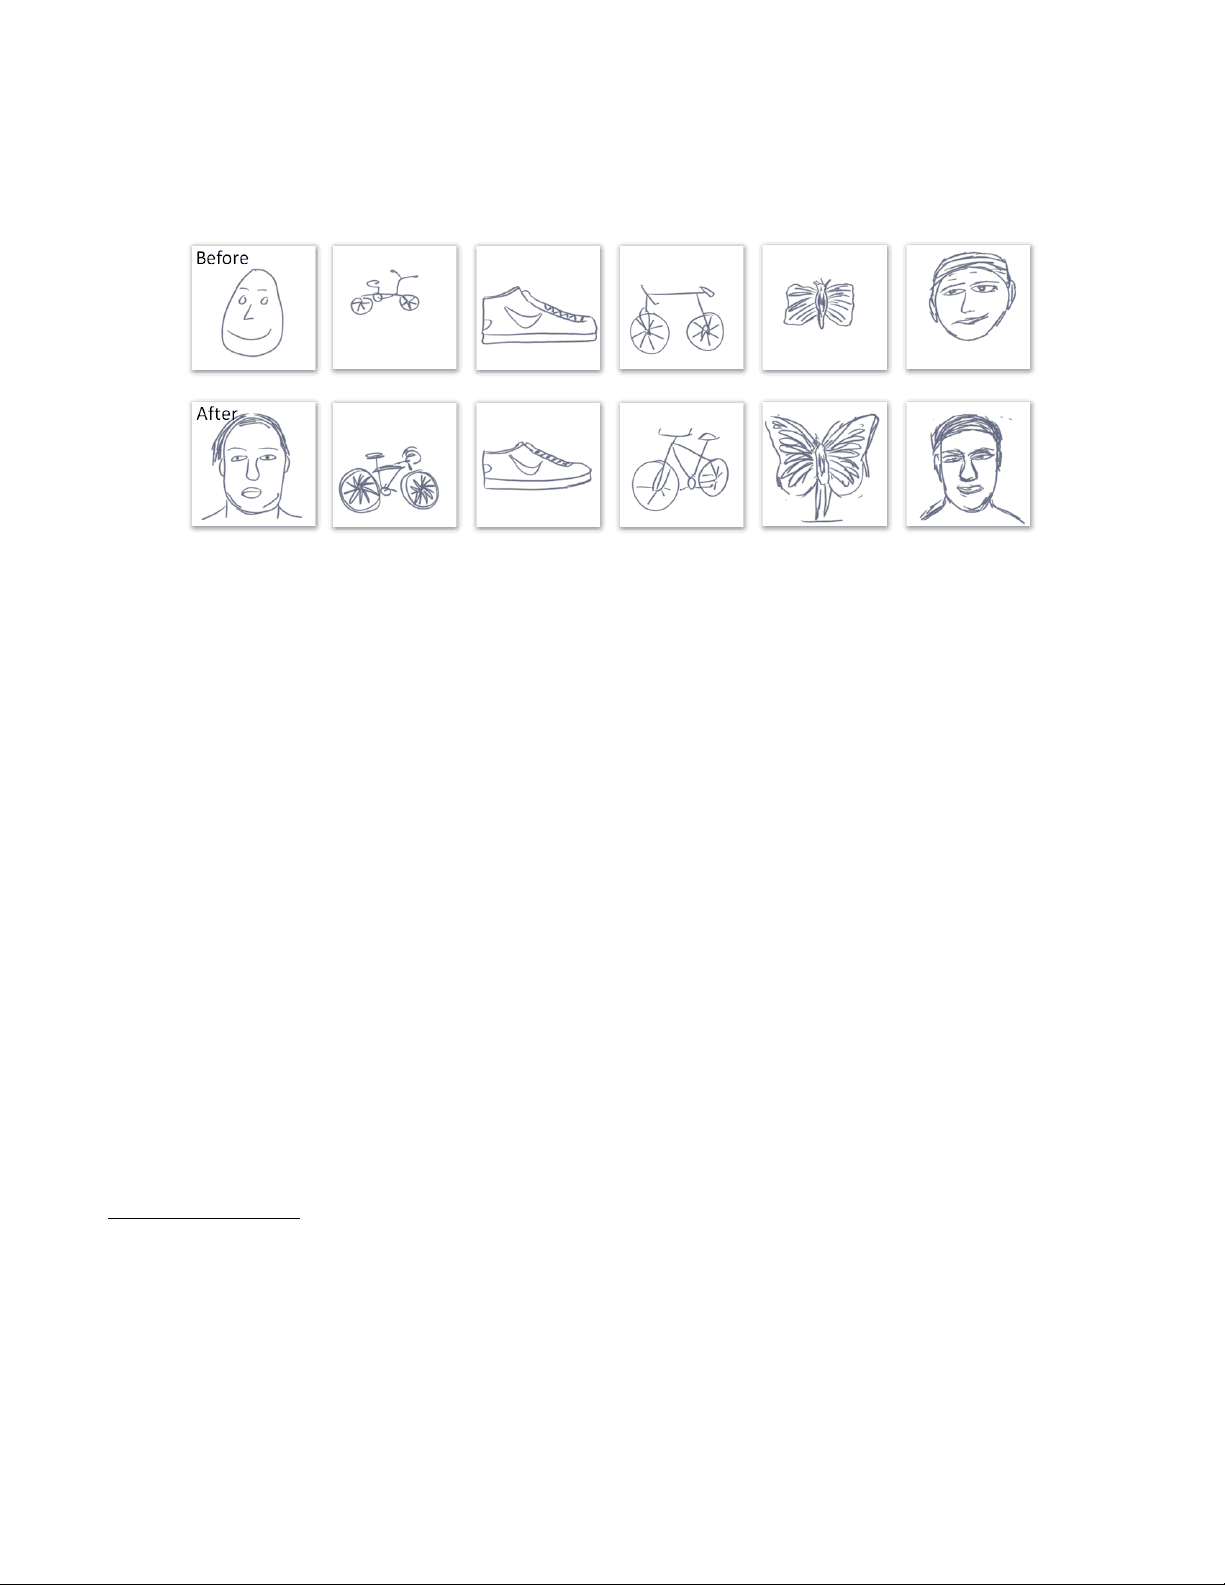
Figure 1: Results of the user study: (top) Freehand drawings of objects without using ShadowDraw, (bottom) freehand drawings of objects using ShadowDraw. Notice the improved spacing and proportions while maintaining the subjects’ own unique styles.
Abstract
We present ShadowDraw, a system for guiding the freeform draw- ing of objects. As the user draws, ShadowDraw dynamically up- dates a shadow image underlying the user’s strokes. The shadows are suggestive of object contours that guide the user as they con- tinue drawing. This paradigm is similar to tracing, with two major differences. First, we do not provide a single image from which the user can trace; rather ShadowDraw automatically blends relevant images from a large database to construct the shadows. Second, the system dynamically adapts to the user’s drawings in real-time and produces suggestions accordingly. ShadowDraw works by effi- ciently matching local edge patches between the query, constructed from the current drawing, and a database of images. A hashing technique enforces both local and global similarity and provides sufficient speed for interactive feedback. Shadows are created by aggregating the edge maps from the best database matches, spa- tially weighted by their match scores. We test our approach with human subjects and show comparisons between the drawings that were produced with and without the system. The results show that our system produces more realistically proportioned line drawings.
CR Categories: I.3.8 [Computing Methodologies]: Computer Graphics—Applications;
Keywords: large scale image retrieval, shape matching, interactive drawing
Links:
1 Introduction
If asked to draw a face, the result for most of us (those with little practice in drawing) might look like one of those in the upper row of Figure 1, created by subjects in our user study using a standard drawing interface. Similarly, if asked to draw a bicycle, most of us would have a difficult time depicting how the frame and wheels relate to each other. One solution is to search for an image of the thing we want to draw, and to either trace it or to use it in some other way as a reference. However, aside from the difficulty of finding a photo of what we want to draw, simply tracing object edges elimi- nates much of the essence of drawing, i.e., there is very little free- dom in tracing strokes. Conversely, drawing on a blank paper with only the image in the mind’s eye gives the drawer a lot of freedom, but freehand drawing can be frustrating without significant training. To address this, we present ShadowDraw, a drawing interface that automatically infers what you are drawing and then dynamically depicts relevant shadows (Figures 5 and 6) underneath the drawing. These shadows may be either used or ignored by the drawer.
ShadowDraw preserves the essence of drawing, i.e., freedom and expressiveness, and at the same time uses visual references, shad- ows, to guide the drawer. Furthermore, shadows from real images can enlighten the artist with the gist of many images simultane- ously. The creation becomes a mix of both human intuition and computer intelligence. The computer, in essence, is a partner in the drawing process, providing guidance like a teacher, instead of ac- tually producing the final artwork. The drawings in the bottom row of Figure 1 were drawn by the same subjects, this time using Shad- owDraw. Notice how the users’ own creative styles remain consis- tent between the drawings, while the overall shapes and spacing are more realistic.
ShadowDraw consists of two main computational steps plus the user interface. The first offline step consists of building a database from a collection of 30,000 images collected from the Web. Each image is converted to an edge drawing using the long edge detector technique developed by [Bhat et al. 2009] and stored. Overlap- ping windows in each edge image are analyzed, coded, and stored. Each window is converted to edge descriptors, and further coded as sketches with distinct hash keys using min-hash [Chum et al. 2008]. In the second online step, as the user draws, ShadowDraw
analyzes the strokes using a similar encoding to determine hash keys for overlapping windows for fast matching with the database of images. The top 100 matching database edge images are further aligned to the drawing. A set of spatially varying weights blend the edge images into a shadow image. In the user interface, the strokes are overlaid on top of an evolving shadow image that provides guid- ance for future strokes.
Our main contribution is an interactive drawing system that dynam- ically adapts to the user’s drawing and provides real-time feedback. A number of technical contributions make ShadowDraw unique. Although portions of ShadowDraw follow the basic framework of content based image retrieval, the technique of partial spatial matching that ShadowDraw employs is novel, in that it allows for multiple matching images based on different sub-regions of the im- age. In addition, the verification stage and methods for determining the blending weights are unique to this work. While there have been previous works that helps users draw basic shapes [Igarashi et al. 1999; Arvo and Novins 2000; Igarashi and Hughes 2001], to our knowledge, we are the first to develop an interactive user interface to assist freeform drawing. We test our approach with human subjects and show comparisons between the drawings that were produced with and without the system. The results show that our system produces more realistically proportioned line drawings, particularly for those who possess some skill but lack expertise. We purposely avoid in this paper, making any claims that the system helps produce more skilled drawers or more artistic drawings.
2 Related Work
The huge volume of image and video data available on the Web, scientific databases, and newspaper archives, along with recent advances in efficient (approximate) nearest neighbor matching schemes have opened the door for a number of large scale match- ing applications. The general field of content based image retrieval (CBIR) uses many different inputs modalities to search for similar images in a database (see [Datta et al. 2008] for a general survey of this field). Here, we briefly review related work in large scale image retrieval techniques, especially those that use line drawings for the query and/or are aimed at constructing new images and drawings.
There are a number of systems that produce photographic-like re- sults by compositing portions of retrieved images. The Sketch-to- Collage system [Gavilan et al. 2007] produces a single composite collage by matching user provided color strokes to a database of images, segmenting out regions and interactively blending the re- trieved segments. The Sketch2Photo system [Chen et al. 2009] pro- duces a composite image from the user’s sketch of a scene with text label annotated objects. Candidate image regions for each object are found on the Web and those that produce the best agreement are put together to form the final composition. PhotoSketch [Eitz et al. 2009] progressively creates images through a sketching and compositing interface. The user interacts with the system to seg- ment and blend the images retrieved from a database of 1.5 million images. Rather than starting from a blank page, the Scene Com- pletion algorithm [Hays and Efros 2007] performs a global scene match using a query image, which has “holes”. The system finds the best images for completing the scene with objects that could have been in the missing regions. To improve retrieval accuracy of these sketch-based systems, researchers have also designed descrip- tors that provide better matches between human drawn sketches and natural images [Chalechale et al. 2005; Hu et al. 2010].
More general CBIR efforts include the early SIGGRAPH work, Fast Multiresolution Image Querying [Jacobs et al. 1995], that matches user paint strokes to underlying wavelet signatures of im- ages in the database. The “Blobworld” approach [Carson et al.
2002] queries image regions rather than the entire image, to allow the user to specify which objects in the image are more relevant to the query. In [Nister and Stewenius 2006], a vocabulary tree is cre- ated to efficiently retrieve images from a large database. The tree defines a hierarchical quantization of the local image features and provides a multi-level scheme to score matching images. In [Chum et al. 2007], the idea of “query expansion” in text retrieval is ap- plied to the image domain, where the highest ranked images from the original query are re-queried to generate additional relevant im- ages.
A 3D photorealistic virtual space is created in [Sivic et al. 2008] to allow users to tour themes, such as city streets or skylines. Sim- ilar images are matched and stitched from a large (few hundred thousand) image collection downloaded from Flickr. Most recently, MindFinder [Cao et al. 2010] aims to improve image retrieval by allowing the user to input a text tag, a sketch, and a color as a query. The system is able to retrieve images that better match the image in the user’s mind. Finally, in [Chaudhuri and Koltun 2010], data-driven suggestions are made for 3D modeling. The system presents suggestions by matching and retrieving relevant shapes in the database to the initial basic model.
ShadowDraw also leverages the idea of matching to a large database of images. Unlike previous methods, our end goal is to help the user draw rather than to perform an image composition, completion, retrieval, or 3D modeling. Furthermore, ShadowDraw uses only a partial and evolving drawing for the query rather than other images and/or textual descriptions. Our system requires the retrieval to run in real time. We have seen no other system that leverages image retrieval for the same kind of application or with partial drawings as the input.
There are interactive drawing interfaces such as Teddy [Igarashi et al. 1999], Fluid Sketches [Arvo and Novins 2000], and the 3D drawing system of [Igarashi and Hughes 2001] that strive to pro- duce better drawings for the user. These methods provide low-level information feedback in the form of basic polygonal shapes, lines, and curves. More recently, the iCanDraw interface [Dixon et al. 2010] provides step-by-step instructions and corrective feedback to guide a user to draw a human face from a reference image. While similar in motivation, our approach provides guidance for drawing arbitrary high-level objects using only example images.
Recently, in [Cole et al. 2008], the authors studied artists’ line drawings of 3D shapes to analyze which line segments were being emphasized, and to compute correlations between those segments and the contours produced using existing computer generated line drawing techniques and contour feature extractors. While our work aims to help users in freeform drawing, the outputs of our system can be a useful resource for this line of work, i.e., the user drawings produced with ShadowDraw can be used for analyzing the contours of more general objects occurring in natural images.
3 Approach
ShadowDraw includes three main components: (1) the construc- tion of an inverted file structure [Witten et al. 1999] that indexes a database of images and their edge maps; (2) a query method that, given user strokes, dynamically retrieves matching images, aligns them to the evolving drawing and weights them based on a match- ing score; and (3) the user interface, which displays a shadow of weighted edge maps beneath the user’s drawing to help guide the drawing process.
Figure 3: An outline of the online processing pipeline. Given a user’s strokes, sketches are computed for each sub-window, and matching votes are accumulated in a histogram. The top 100 matching images are aligned, scored, and weighted to generate the final shadow image.
the user’s drawing and scored. This two step matching procedure is necessary for computational efficiency, since only a small subset of the database images need to be finely aligned and weighted. We use the scores from the alignment step to compute a set of spatially varying weights for each edge image. The output is a shadow image resulting from the weighted average of the edge images. Finally, we display the shadow image to the user as described in Section 4.
Candidate matches We represent the user’s drawing as a set of
vectorized multi-segment strokes. We create an edge image E˜ from these strokes by drawing lines with a width of one pixel between the stroke points. The rendered lines have the same style as the edges extracted from the natural images in the database, i.e., the edge
image E˜ used for matching does not use the stylized strokes that are seen by the user described in Section 4. Next, we compute BiCE descriptors and their corresponding sketches in the same manner as described in Section 3.1, this time using a higher resolution grid of 18 × 18 = 324 patches with 75% overlap between neighboring patches. We use a higher resolution grid to increase the accuracy of the predicted position, and to increase invariance to translations in the drawing. In our implementation, the user’s drawing occupies an area of 480 × 480 pixels, resulting in 96 × 96 pixel patches with 24 pixel offsets between neighboring patches. We compute descriptors and sketches for each of the 324 patches.
Using the inverse lookup table, we match each sketch from the user’s drawing to the sketches stored in the database. A match- ing sketch casts one vote for the corresponding database image and patch offset pair. We aggregate the matches in a histogram H stor- ing the number of matching sketches for each image at each grid offset. To reduce the size of H, votes are only stored if the database patch offset is within four patch grid points of the patch being con- sidered in the user’s drawing. This corresponds to relative shifts of less than 96 pixels between the user’s drawing and the database im- ages. The resulting histogram has size m × 9 × 9 , where m is the number of images in the database. After adding all the matches for each sketch to the histogram, we find the best matching offset for each image, and add the top 100 images to the candidate set C. As discussed in Section 3.1, we compute n = 20 sketches for each de- scriptor, resulting in a maximum possible 20 votes per sketch in the histogram. To reduce the bias from any single descriptor, we limit the contribution of each descriptor to four votes in the histogram.
Given a large database, computing the candidate set as described above can be computationally expensive. We take advantage of the fact that the user’s strokes change gradually over time to increase performance. At each time step, only votes resulting from sketches derived from patches that have changed are updated. We accom- plish this by subtracting the votes added from the previous sketches from H, followed by adding in the votes from the new sketches. At each time frame, we also include in the candidate set any database
Figure 4: Illustration of spatial weights: (a) user’s view, (b) shadow image, (c, d) top two matches and corresponding spatial weights (top right).
image that contributed to the shadow image in the previous time frame.
Image alignment The candidate image set C contains a set of im- ages with approximate offsets dx and dy defined by the best match- ing offset as described above. The approximation arises from the discretization of the offsets in the grid of patches. We refine these offsets using a 1D variation of the Generalized Hough transform [Ballard 1981]. Using the standard Generalized Hough transform for 2D translations, we create a 2D histogram T over possible off- sets x and y using:
T (x, y) =
p
E^ ˜(px, py )E(px + dx + x, py + dy + y), (2)
where E˜(px, py ) is the value of E˜ at pixel p in location (px, py ), and similarly for the edge image E. We determine the best offset by finding the maximum value of T (x, y). This approach is computa- tionally expensive since we need to sum over the image for every possible combination of x and y offsets. Instead we compute the x and y dimensions separately using two histograms:
Tx(x) =
p
sin(˜θ(px, py )) E˜(px, py ) (3)
sin(θ(px + dx + x, py + dy ))E(px + dx + x, py + dy ),
and similarly for Ty using the cosine of the angles. The sine of the edge angles provides higher weights to the more informative ver- tical edges when determining the horizontal offsets, and similarly for Ty and cosine with horizontal edges. We empirically found this approach to produce good results. Once the histograms Tx and Ty are created, they are slightly blurred with σh = 2. We determine
Figure 5: Rendering pipeline for user interface: (a) user’s rendered strokes, (b) weighting based on pen position, (c) shadow image, and (d) final rendering.
the final sub-pixel offsets d′ x and d′ y by adding a quadratic interpo- lation of the resulting peak response in Tx and Ty to dx and dy. For additional accuracy, two iterations are run. To reduce computation, we limit the search range of x and y to twice the distance between the grid points. In addition, we compute Equation (3) on reduced resolution images of size 160 × 160. We notate the aligned edge image as E i′. To refine the scale, an additional 1D histogram Ts may be similarly computed across scales and the peak found.
Image weighting We now have a set of candidate images, C, and their aligned edge images E′ i, aligned using offsets d′ i. Our goal is to blend these aligned edge images into a shadow image, S, that will help guide the user as they draw:
S =
i
WiE i′, (4)
where Wi is the blending weight image, which we define below. The blending weight should be high for pixels where there is a good match between the drawing and the candidate’s aligned edges and low for pixels where there is not. We construct the weight im- age from two terms, a global match term vi and a spatially varying match term, Vi, which are normalized over all images in the candi- date set:
Wi = α
viVi ∑ j vj^ Vj
The weight α is used to reduce the visibility of noisy shadows pro- duced when the drawing has just started and all the match scores are low. An illustration of the spatial weighting is shown in Figure
- The use of a spatial weighting results in shadows that are a com- posite of multiple distinct edge images, creating the appearance of an object that does not exist in a single database image.
We begin by defining the spatially varying match term Vi followed by the global match term vi and α. Our goal is for a candidate image’s weights to increase when its edges agree in position and orientation with the user’s strokes. To compute Vi, we first de- compose each candidate edge image into eight oriented images, ϑt, and similarly, the drawing image into eight oriented images, ϑ˜t, for t = 1,... , 8. Each image captures only strokes parallel to one of eight evenly spaced orientations; i.e., ϑ 1 depicts horizontal edges, ϑ 5 depicts vertical edges, and the remaining six each capture one other orientation at 22. 5 ◦^ intervals. If an edge’s orientation falls in between two orientations, its contribution is linearly divided be- tween the two oriented edge images.
To provide some invariance to position, we blur the oriented edge images with a Gaussian kernel G(σs) with a standard deviation σs = 1. 25 ϕ, where ϕ is the relative distance between the grid points. It is also desirable that images that contain multiple edges near a stroke receive the same score contribution as those with a single edge. This is accomplished by limiting the magnitude of the
response from the blurred edges to the maximum response that may result from a single edge in isolation.
We then compute positive and negative edge correlation images, ϑ+ and ϑ−, to determine where the edge image agrees and disagrees with the user’s strokes. We define positive correlation using the product of the edge images with the same orientations, and define negative correlation using the product of orthogonally oriented edge images: ϑ+^ =
t=1, 8
ϑt ∗ ϑ˜t (6)
ϑ − =
t=1, 8
ϑt ∗ ϑ˜(t+4)%8 (7)
Our spatially varying match term Vi is simply a Gaussian blurred version of ϑ+, Vi = G(ϑ+ i , 4 ϕ) (8)
We add a small offset to Vi to ensure non-zero values. To reduce computation, we compute the image scores and weights on reduced resolution images of 40 × 40 pixels.
Next, we define the global match term vi in Equation (5) that is used to compute the edge image’s blending weights Wi. To aid in the computation of vi, we compute a global match score hi for each image using the difference between ϑ+^ and ϑ−,
hi =
p
ϑ+ i (p) − ϑ− i (p) (9)
Equation (9) has a high positive value when the user’s strokes and the image’s edges agree in position and orientation. However, if a majority of the user’s strokes are perpendicular to the image’s edges, hi may be negative.
Finally, we compute vi using a nonlinear function of hi and the average h∗^ of the five highest scores from the candidate set,
vi = max
hi − γh∗ h∗^ − γh∗
)κ)
. (10)
We assign a value of 0. 5 to γ, which means the value of vi is greater than zero only if the score is greater than half the average of the five highest scores. A value of κ = 2 favors images with higher scores and sets the rate of weight decay as quadratic. In Equation (5), we set α to α =
i vi � +
i vi
where � to corresponds to the score that would result from draw- ing a single stroke of approximately 250 pixels. Using Equation (11), α increases as the user draws more stokes, resulting in greater visibility of the shadows.
Figure 7: Evaluation scores of drawings by users in the “poor”, “average”, and “good” groups. ShadowDraw achieves signifi- cantly better drawing results for the “average” group.
Using our large database, the user can receive guidance for a va- riety of object categories, including specific types of objects such as office chairs, folding chairs, or rocking chairs. The last row of Figure 6 demonstrates the scoring function’s robustness to clutter. Even when many spurious strokes are drawn, the correct images are given high weight in the shadow image.
5.1 User Studies
We conducted a user study to assess the effectiveness of Shadow- Draw on untrained drawers. In the first stage, subjects produced quick 1-3 minute drawings with and without ShadowDraw. In a second stage, a separate set of subjects evaluated the drawings.
Drawing We conducted the experiment with 16 subjects, eight women and eight men. Each subject was asked to draw five ob- jects, Shoe, Bicycle, Butterfly, Face, and Rabbit, with and without ShadowDraw, for a total of 10 drawings. We randomly permuted the sequence of objects presented to each user. The shadows ap- peared on every other drawing; thus half the objects were drawn first without shadows and the other half drawn first with shadows. We used Rabbit as a control variable to ensure fairness of the ex- periments: there were no rabbit images in our database. Please see the supplementary video for example drawings by the subjects.
Before beginning the study, we explained the UI: the functionality of the pen (drawing and erasing), the white canvas, and the “start” and “next” button to proceed to the next object once the current drawing was completed. We explained to the user that shadows would appear on every other drawing, and that he/she was free to use them for guidance or to completely ignore them. We also ex- plained that the shadows could be removed by tapping on a region outside of the canvas (and would reappear as the user started draw- ing again). Warm-up exercises to acquaint them with the interface included drawing a circle and a t-shirt.
Each user was given 30 minutes to complete all 10 drawings. We recorded the sequence of keystrokes (both drawing and erasing), and time spent on each drawing. On average, the users completed the task in about 20 minutes, spending more time on objects which require more detail such as Faces and less on those such as Shoes. We also asked subjects to fill out a short questionnaire at the end of the study.
Evaluation Eight additional subjects (who did not participate in the drawing experiment) evaluated the drawings. We displayed
Figure 8: Per category evaluation scores of drawings by users in the “average” group. ShadowDraw improves drawing results for most categories.
each drawing pair (produced with and without ShadowDraw) side- by-side. We asked each evaluator to choose what she perceived to be the “better drawing”. If she could not decide, she was given the option of choosing “tie”. This was repeated for all drawing pairs. We randomized the order and placement of the drawings, so that the drawings produced with ShadowDraw did not always appear left or right.
To assess the user’s drawing abilities, we next asked each evaluator to rate each user’s collection of drawings produced without Shad- owDraw on a scale of 1 to 5, where 1 is poor, 3 is average, and 5 is excellent. We grouped the users into three groups (poor, average, and good) based on their drawing ability score, by averaging the eight evaluator ratings. It should be noted that none of the subjects was rated as close to excellent, as all ratings averaged below 4.
Analysis and Remarks We first present our findings on the drawing scores per group for all object categories. Figure 7 shows the results. We compute an average score per group (i.e., by av- eraging the individual user votes in the group). The “poor” group has three users, with scores in [1, 2); the “average” group has seven users, with scores in [2, 3); and the “good” group has six users, with scores above 3.
Overall, ShadowDraw achieves significantly higher scored draw- ing results for the “average” group, and inconclusive results in the other two groups (see Figure 7). Figure 8 shows the per category breakdown of scores for the “average” group. ShadowDraw was particularly helpful for drawing structurally complex objects like bicycles. We see noticeable improvement for faces and butterflies as well. The rabbit category was used as a control variable, so the “tie” result was expected. Shoes showed some decline with Shad- owDraw perhaps because the variability in shoe appearance pro- duced a higher amount of noise in the shadow image.
The lack of higher scores in the “good” group confirms our in- tuition that people who can draw quite well will produce equally good drawings with or without ShadowDraw. The interesting phe- nomenon is the insignificant difference in the scores for the “poor” group. Upon closer inspection of their drawings, we found that these users were extremely poor drawers (i.e., the aspect ratios and basic shapes of their drawings were far off from those of the objects they were intending to draw) and thus the system had no chance to properly match and retrieve relevant database images. This also ex- plains why we achieve significant improvement over the baseline for the “average” group. The users in this group are able to draw the basic shapes and rough proportions of the objects correctly, but
Figure 9: Example face drawings produced without ShadowDraw and after training with ShadowDraw. Each pair was drawn by the same subject.
have difficulty applying exact proportions and details essential for producing compelling drawings, which is precisely where Shadow- Draw can help.
There are several remedies to allow even the poorest drawer to ben- efit from our system. The most obvious is to give them more prac- tice to learn the capabilities of the system. To test this hypothesis, we asked each user to draw another face after they completed the previous task. We allowed the user to explore and suggested that the user draw a more “oval” vs. “round” face outline to get more relevant shadows. Figure 9 shows some examples of the users’ drawings of faces before and after such practice. There is a no- ticeable change towards realistic proportions in the drawings for those with poor skill (left) and good skill (right). Notice how the subject’s personal style is maintained between drawings, and that the more proficient drawers are not simply tracing the shadows. Al- though most would agree the poorer results have been improved, it becomes a matter of taste for the more skilled drawings whether the new drawings are better. Truly assessing the overall aesthetic improvement in the results is beyond the scope of this paper.
Figure 1 shows some more examples of the users’ drawings with and without ShadowDraw. Each column shows the drawings pro- duced by the same user. One can clearly notice a significant change towards more realism in the drawings, especially in terms of the proportions of the different parts of an object and including impor- tant features such as the structure and layout of the object (see the bicycles), and overall shape (see the butterflies).
User Satisfaction When asked in the questionnaire, “How would you compare your drawing results with ShadowDraw vs. those without ShadowDraw?,” on average, the users gave a score of 4.0 in a range where 1 is “much worse”, 3 is “no difference”, and 5 is “much better”. When asked, “How would you rate your satis- faction of drawing with ShadowDraw vs. without ShadowDraw?,” on average, the users gave a score of 3.9. Some positive comments from an open ended question included:
- “Fun and helpful, I became dependent on it very quickly.”
- “Helps in drawing faster than without ShadowDraw”
- “This is a great product and I already love it - got to have one. Really helps me relax!!”
- “Having no background in art, ShadowDraw made drawing a lot of fun when a shadow was provided.”
There were a couple of comments indicating that ShadowDraw was sometimes distracting, such as “...I occasionally got confused about my lines vs. shadow lines.” For this, we can create a button on the UI labeled as “Shadow on/off”, so that the user can choose to view or hide the shadows.
Overall, the users appeared to enjoy using ShadowDraw and pro- duced better drawings (as self-rated) than they could achieve with- out ShadowDraw. This is the essence of what defines ShadowDraw. It does not produce the final artwork; rather, it guides the user when the user wants the help. This makes the drawing experience fun, and with that, the final drawing becomes visually pleasing to one’s self.
6 Conclusion and Discussion
We have presented a system that guides a user to draw by dynam- ically producing shadows derived from thousands of images. We have demonstrated that our method can retrieve relevant images in real time based on incomplete and evolving sketches by the user.
We reported on a user study that showed improved realism in many users’ drawings, but more importantly, we learned a number of un- expected things from the study. Perhaps the most interesting find- ing was that ShadowDraw was most effective for those that had a modicum of drawing skill. We can surmise that those with little skill were unable to produce initial drawings sufficient for the re- trieval of relevant images for the production of shadows. Those already possessing drawing skill may have been distracted by the shadows. There are a number of ways we hope to alleviate both issues to address the needs of a wider range of users. For more novice drawers, being able to specify the category class would trim the database search and would likely lead to more relevant shadows even when the initial drawing has little resemblance to the class. For more expert users, an interface providing more control over shadow strength can be easily added. Also, an ability to draw neg- ative strokes to discourage shadows containing those strokes would again provide finer control over the shadow guidance.
We also want to explore the trade-offs between image database size and the shadows’ efficacy. We have shown the ability to handle many thousands of images over a wide variety of categories. While more flexibility would be attained by a larger database for experts, the problems encountered by the novice drawers might be accentu- ated. More work is required to understand these trade-offs.